
A pedigree analysis chart provides an important tool to study the inheritance of genes. It also gives precise information about the family members through diagrammatic representation. Sometimes, it is also known as the “family or genealogic tree“.
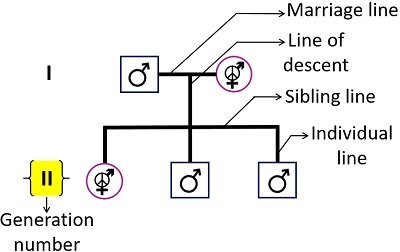
A pedigree chart uses internationally accepted symbols, lines, numbers, and letters To illustrate different individuals, their interrelationship, the number of individuals, and the number of generations.
It gives an idea to understand the mode of inheritance of human traits and diseases. This post mainly focuses on the definition, symbols, types, examples, and importance of the pedigree chart. You will also get to know the points to read the pedigree chart.
Definition of Pedigree Analysis
It refers to the genetic representation that depicts the family tree or biological relationship between individuals of the new generation and their ancestors. A pedigree chart also entails information about genetic disorders in the family history. It helps in studying different patterns of inheritance and genetic traits of different individuals.
In other words, we can define that pedigree analysis as an analytical method, displaying data on the heredity of traits and disorders. It uses specific symbols to represent the type of individuals and their relationship with each other.
Pedigree Chart Symbols
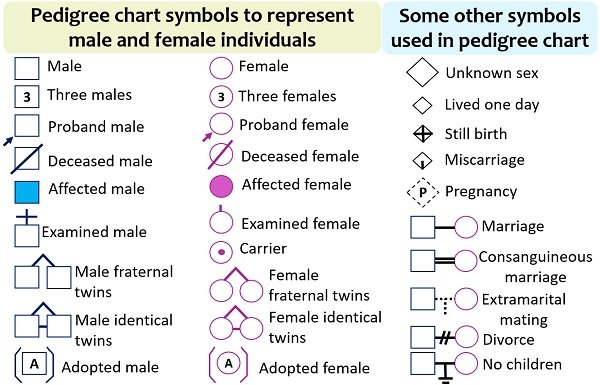
An arrow pointing towards the symbol indicates proband individuals or they usually have the disorder of interest. A slash through the symbol represents deceased individuals.
A fully shaded symbol indicates affected individuals. A central dot within a symbol depicts a carrier. Two arrows merging on the top of symbols determine fraternal twins.
A line between the two symbols and two arrows merging at the top represents identical twins. A letter ‘A’ within the symbol and double brace indicates an adopted child.
Besides these, other symbols are also illustrated in the above diagram. You can memorize all the symbols given in the diagram above to analyze the heredity of traits and disorders in the family history.
Types of Pedigree Analysis
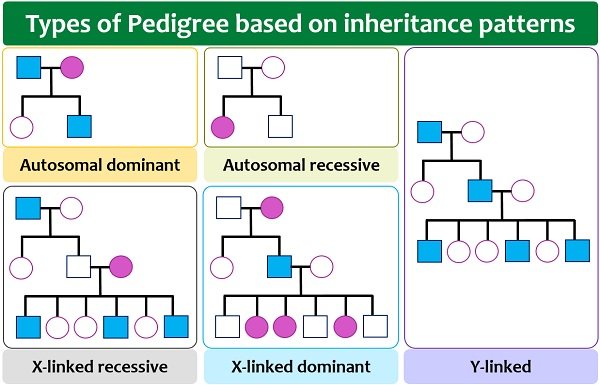
- Males and females get affected in the same ratio.
- The genetic traits express themselves in each generation or never skip a generation.
- Two affected parents can produce an unaffected child.
- Unaffected parents produce unaffected offspring.
- Heterozygotes are also affected.
Autosomal recessive pedigree chart: To determine autosomal recessive inheritance, look for the following features:
- Males and females are affected in the same ratio.
- The genetic trait may skip a generation.
- Two affected parents will only produce affected children.
- Unaffected parents may produce affected offspring since they are carriers or heterozygotes.
- Heterozygotes have a normal phenotype.
X-linked dominant pedigree chart: To determine x-linked dominant inheritance, look for the following features:
- Both males and females are likely to be affected.
- The genetic traits may skip a generation.
- The affected father can transfer the disease to all female individuals.
- Male to male disease transmission does not occur.
X-linked recessive pedigree chart: To determine x-linked recessive inheritance, you must keep the given features in your mind:
- Males are relatively more affected than females.
- The genetic trait never skips a generation.
- Only the affected mother can transfer the disease to the male individuals.
- Disease transmission from a father to a son will not occur.
Y-linked recessive pedigree chart: To determine y-linked recessive inheritance, you must keep the following features in your mind:
- Only males are affected.
- Y-chromosome carries the genetic trait.
- Disease transmission occurs from a father to a son.
How to Read a Pedigree Chart
To read a pedigree chart, you must follow the given protocol:
Determine the mode of inheritance: Look into the chart to identify the inheritance pattern, whether it is autosomal or sex-linked. Males and females are equally affected in autosomal inheritance. Oppositely, males are more likely to be affected in sex or x-linked inheritance.
Determination of traits: Then, see the chart to identify the traits (whether dominant or recessive). Dominant traits will never skip a generation, and one of the parents must carry the trait. Recessive traits may skip a generation, and a parent doesn’t need to carry the trait since they can be heterozygous.
Pedigree Analysis Examples
Let us take some examples to solve the pedigree problems or to identify the type of pedigree.
Autosomal Dominant Pedigree
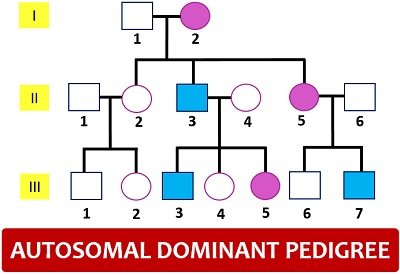
Starting from the left, you can see unaffected parents have unaffected offspring in the F-3 generation, which is also a dominant trait. In the other two relationships, you can see that the ratio of affected males and females is similar, which indicates an autosomal inheritance.
Autosomal Recessive Pedigree
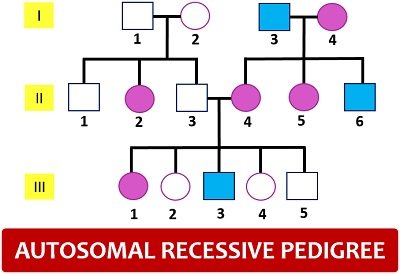
Now, look into the second family in the F-1 generation. All progenies of the F-2 generation acquire the disease due to the affected mother and father, a feature of recessive trait where two affected parents will always produce affected children.
Then, look into the interrelationship between the individuals of the F-2 generation. Individual number 3 and 4 indicates a couple, and they produced infected male and female child in the F-3 generation. Here, in this pedigree, you can see that the ratio of affected males and females is almost the same, which indicates an autosomal inheritance.
X-Linked Dominant Pedigree
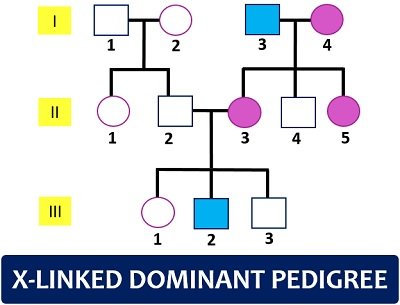
We have already discussed that X-linked dominant traits transfer from an affected father to all daughters, and male to male transmission does not occur. Then, look into the interrelationship between the individuals of the F-2 generation.
Individual number 2 and 3 indicates a couple. Again, recall a dominant trait feature where the affected individuals must have one affected parent. So, this scenario confirms that the pedigree shows the dominant trait, not recessive.
Here, you can see a crisscross pattern between individuals in each generation, indicating a sex-linked inheritance mode in this pedigree chart.
X-Linked Recessive Pedigree
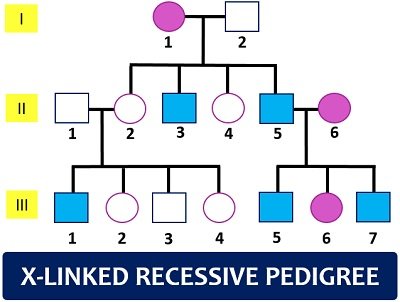
Then, look into the interrelationship between the individuals of the F-2 generation. Individual number 1 and 2 indicates a couple. Both parents are unaffected, but the disease has occurred in the F-3 generation, which shows a recessive pattern.
Then, the affected couple (numbers 5 and 6) transfer the disease to all individuals of the F-3 generation, which is again a feature of the recessive trait. Here, you can see more infected males, indicating a mode of sex-linked recessive inheritance.
Y-Linked Pedigree
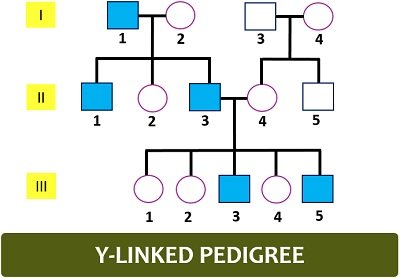
The second family in the F-1 generation has an unaffected father, so the disease will not transfer to the male individual of the next generation. Then, look into the interrelationship between individuals of the F-2 generation.
Individual number 3 and 4 indicates a couple, where an affected father transferred the disease to his sons in the F-3 generation. You can only see the affected males in this pedigree, which indicates a sex-linked inheritance.
Importance
Pedigree's analysis reveals the family history by studying the inheritance of traits and diseases between family members across generations. It also helps in genetic counseling. Besides, it determines the dominant or recessive nature of the trait.
The pedigree chart also entails the type of chromosome (autosomal or sex). We can also identify genotypes as well as phenotypes of family members. Determining the probabilities of phenotypes in future generations becomes easy through pedigree analysis.


0 Comments